Physical Modelling
linking 3D particle-scale structures to the evolution of gravel bed morphology
Work Package 2
Physical modelling of key factors
Field measurements provide details on the development of structure under a broader range of flow and transport conditions than can be applied in the flume. A more controlled environment is required to isolate the individual and combined effects of stress history (as induced by bed morphology), fine sediment (cohesive and non-cohesive) and sediment load applied to the bed on the development of bed structure critical shear stress (O2).
Laboratory
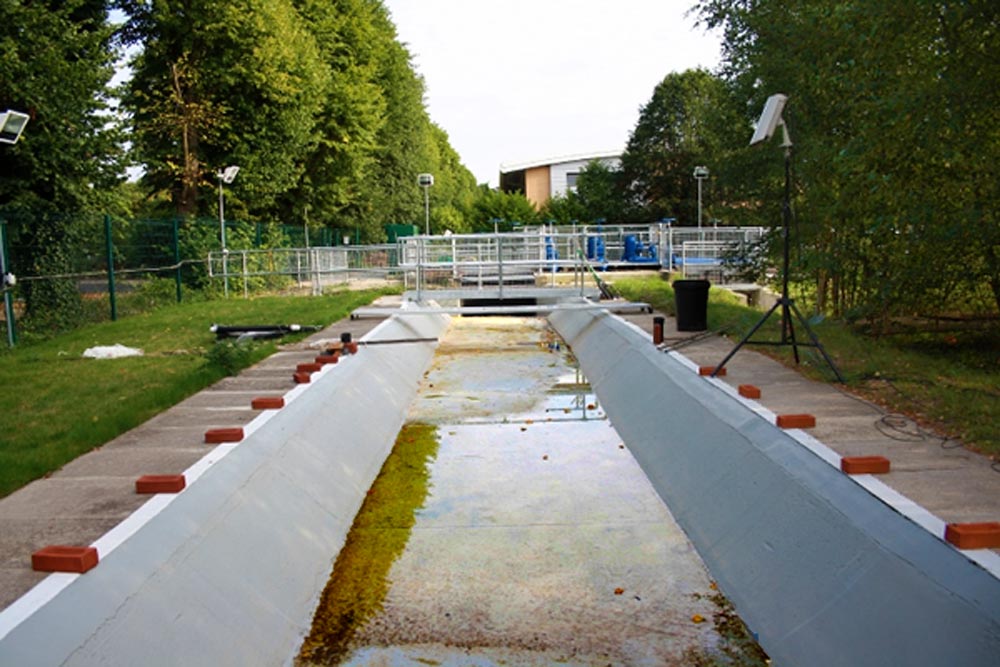
Real-size flume runs will take place at the University of Southampton’s Chilworth Science Park. Flume dimensions are:
- Length (working) – 60 m
- Width – 2.1 m
- Depth – 0.5 m
The flume has a maximum flow capacity of 0.8 m3 s-1 – sufficient to water-work the framework sediment. Two annular flow meters will monitor discharge. An ADV rig (2 x ADVs) will permit precision acquisition of 3D flow structure anywhere in the flume. TLS and image analysis (informed by PP SPR) will be used for topographic mapping, monitoring of bed structure development and clast entrainment.
Experimental approach
The set of experiments to be performed is outlined in Table 1 with flume set-up in Figure 1. The main variables to be assessed are:
- bed morphology (plane bed vs. riffle-pool),
- the volume and cohesion of fine sediment present in the flume
We use a riffle-pool morphology to test the hypothesis that the effect of bed structure development is maximised in the presence of downwelling flows induced by bed morphology. Plane beds are incorporated into this experimental design to provide a benchmark for runs with a riffle-pool configuration, and for comparison with previous work. We also hypothesize that critical shear stress will increase proportionally with the quantity of fine cohesive material via the development of ‘mortaring’ (sensu 5). To test this, we will conduct runs with and without cohesive fines, and apply the fines in different quantities by replicating a range of sediment concentrations observed in natural rivers during flood recession.Table 1 – Parameters for the Chilworth Science Park flume experiments.
| A | B | D | E | ||||||||||
|---|---|---|---|---|---|---|---|---|---|---|---|---|---|
| Run name | C | A1 | A2 | A3 | B1 | B2 | B3 | D1 | D2 | D3 | E1 | E2 | E3 |
| Bed morphology | Flat | Riffle-pool | |||||||||||
| Fine sed. composition a | None | no <63 µm | with <63 µm | no <63 µm | with <63 µm | ||||||||
| Fine sed. conc. (mgL–1) b | – | 25 | 50 | 100 | 25 | 50 | 100 | 25 | 50 | 100 | 25 | 50 | 100 |
| Repeats | Three repeats, giving a total of 39 individual runs | ||||||||||||
| Sediment pots | Five pots per run, giving a total of 195 scanned pots | ||||||||||||
| Stress history magnitude | Antecedent stress magnitude of 0.5 τc and a duration of 24 hours | ||||||||||||
| Framework grainsize | Same as BGB field site GSD for sizes > 1 mm |
a fine sediment will have the same grain size distribution (GSD) as the Bury Green Brook (BGB) field site for sizes < 1 mm. The cohesive faction < 63 µm will be present or absent depending on the run. b derived from UK database of suspended sediment concentrations 0.25 mgl -1 is the European limit for benthic spawning fish.

Experimental setup
Due to the unique size of the flume facility, experimental parameters can be prototype scale (i.e. grainsize, width, slope, and depths will be the same as the field site). Prior to each flume run, five plastic mesh pots (0.2 m3) will be embedded in the bed, and the sediment surface screed flat (Run sets A-C Table 1), or formed into a riffle-pool sequence (Run sets D-E Table 1). The experimental bed area will be scanned at 1 mm resolution using TLS, and a random sample of the sediment pots will be removed prior to water-working, CT-scanned and replaced. These data together with the DEMs generated by the TLS will provide a benchmark for comparison with the water-worked pots. The bed will be reset prior to all subsequent runs.
Experimental operation
Each experiment will be run for 24 hours, which represents the time required for the majority of bed structure development. Following each run the bed will be scanned to determine change in bed surface topography by differencing each DEM. Prior to pot removal, lift force and pivot angles will be determined for particles > 8 mm in a 0.5 m2 patch around each pot. In combination with analysis of the TLS scans, the variables in the model of Hodge et al. (2013) will be derived. The pot will then be extracted and transported to the µ-VIS facility for scanning. Maximum information will thus be derived from the bed prior to any disturbance, and can be compared to the equivalent datasets derived from the CT-scanning.
Expected outcomes
The experimental design is configured to capture the variability in bed structure developed under plane bed and riffle-pool bed morphology. Field and flume measurements have demonstrated that despite steady, uniform flows, variations in bed morphology at grain and microtopographic scales result in local variations in bed shear stress, and turbulent kinetic energy. These variations interact with the existing bed material to develop bed structure. We have established that in the presence of morphology, these structural patterns are enhanced. Hence, we predict that despite a uniform steady flow, we will establish considerable variability in stress history. The experiment is thus designed to take advantage of this variability without the need to run different stress history flows
Measurements
We will quantify the flow field over each pot for all runs. Above each pot, and for each flow, 3D flow velocity time-series (90–s duration) will be acquired at each node on a grid using 2 synchronized, down-looking, Sontek Micro ADVs mounted on a computer-controlled traversing gantry. At each node we will measure the 3 orthogonal velocity components at 0.2, 0.4 and 0.8 of flow depth.
Data analysis
The ADV time-series will be scrutinised to ensure correct removal and replacement of erroneous points (resulting from high-frequency noise and aliasing). Each time series will be filtered, de-spiked and have replacements made. The quality-assured data will be analysed to provide instantaneous and time averaged shear stress over the pot surface; turbulent kinetic energy, octant analysis and POD to define coherent flow structure over each pot. Software algorithms developed by co-investigator David Sear will permit quality-assured batch processing of these datasets. 3D CFD will be used to model the spatial distribution of shear stress between surface grains and across the surface at up to 2 mm resolution, providing higher resolution data than the ADV measurements.
Variable interactions
For each flume experiment we will have the controlling variables (flume morphology, fine sediment load and concentration, degree of cohesion, flow properties over the pots) and the results (sediment structural properties measured in the flume and from the CT-scan data). We will explore the interaction of these factors by statistical modelling to determine which exert the strongest control on critical shear stress, and infer from this the causal mechanisms we need to incorporate within WP3.
Suggested Reading
(Pdf) Hodge, R., Sear, D.A. and Leyland, J. (2013) Spatial variations in surface sediment structure in riffle-pool sequences: a preliminary test of the Differential Sediment Entrainment Hypothesis (DSEH). Earth Surface Processes and Landforms, 38(5), 449-465 (doi:10.1002/esp.3290)
(Pdf) Ockelford, A. and Haynes, H. (2013) The impact of stress history on bed structure. Earth Surface Processes and Landforms, 38(7), 717-727 (doi: 10.1002/esp.3348)
(Pdf) Rice, S.P., Buffin Bélanger, T., Lancaster, J., Reid, I. (2008) Macroinvertebrate movements across a gravel-bed substrate: effects of local hydraulics and microtopography under increasing discharge. In: Habersack, H., Piegay, H. and Rinaldi, M. (eds). Gravel-Bed Rivers VI: From Process Understanding to River Restoration, Elsevier, pp.637-660, (doi: 10.1016/S0928-2025(07)11152-4)
(Pdf) Sear, D.A., Damon, W., Booker, D.J. and Anderson, D.G. (2000) A load cell based continuous recording bedload trap. Earth Surface Processes and Landforms, 25(6), 659–672 (doi:10.1002/1096-9837(200006))