Sediment Structure
linking 3D particle-scale structures to the evolution of gravel bed morphology
Work Package 1
Quantifying sediment structure in a natural river system
At the beginning of the project, Bury Green Brook was instrumented with:
- Pressure sensors – provide 15-minute flow-depth data, which will provide information on water-surface slope.
- Suspended sediment samplers – stage-triggered pump samplers and isokinetic samplers for bulk suspended sediment grainsize enabling suspended sediment concentrations calculation.
- Bedload-impact sensors – provide information on the onset and duration of sediment transport in the riffle-pool subunits.
- Continuous bedload samplers – record the input and output sediment loads to the study reach and bedload grainsize distribution.
- Sediment pots – located in pairs in pool-entry, pool, pool-exit, and riffle locations for 3D CT measurements.
These instruments will provide a high-resolution (sub-hourly) dataset on the flow and sediment transport conditions for the duration of the project. Further data will be collected during five additional field visits in order to quantify both the reach-scale topography and the grain-scale sediment structure. These data will be collected at the start and end of the project, with three more visits after significant flow events. A lack of suitable flow events over the two years is unlikely, and if necessary the monitoring can be extended by a year. Frequent site visits and a telemetry system mean that equipment failure will be quickly identified.
Channel structure data
Data collected during each visit includes:
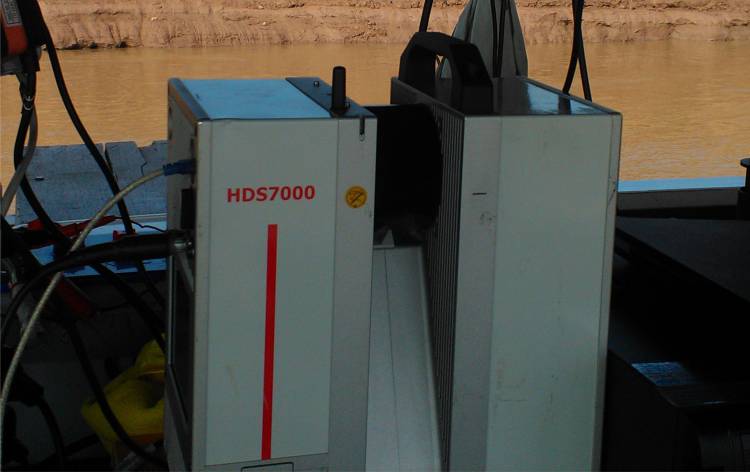
- Repeat surveys of channel morphology over a 100-m reach using TLS at a resolution of 0.01 m (Fig 1).
- Repeat measurements of grain-scale sediment properties in ten 1 m2 patches using the techniques developed by Hodge et al (2013). The patches will be selected to cover the positions within the riffle-pool morphology used in the flume experiments (e.g. pool-entry, pool, pool exit, riffle), as well as variations in grain size and depth within these morphologies. Properties to be measured are:
- Sediment grain size distribution (GSD)
- Grain pivot angle, grain size and mass
- Grain resistance to lifting, grain size and mass
- Collection of the eight sediment sample pots for measurement at µ-VIS.
Flow data
Dilution gauging and velocity profile measurements will be undertaken during high flow events to provide velocity data and a discharge rating curve for the reach. To quantify the spatial variation in flow, and hence stress history, 3D flow modelling will be used to assess spatial and temporal variation in shear stress under a range of flow conditions. The measured flow data will provide the appropriate boundary conditions and validation data for the CFD model. The CFD model provides a finite volume solution of the full three-dimensional Navier-Stokes equations in a Cartesian co-ordinate system, with a Renormalized Group Theory k–ε turbulence model. The gravel topography will incorporated into the CFD scheme by the application of a Mass Flux Scaling algorithm developed by Rich Hardy and has previously been validated for a series of high resolution applications.
Data synthesis
This ensemble of field measurements will enable us both to identify the range of 3D sediment structures that occur within a natural channel, and the extent to which they vary in response to flow and sediment supply. From these data we will quantify the variation in sediment structure and critical shear stress, and identify how persistent these patterns are under different flow regimes. Comparison between the temporal variation in the pattern of critical shear stress and the channel morphology will provide insights into the extent to which critical shear stress controls morphological change. These field data will be used to provide scaling for flume experiments in WP2, and to provide a comparison to the flume results. They will also be used for model validation in WP3. Furthermore, the combination of flow data, high resolution topography and sediment structure will result in a unique dataset with benefits to the wider academic community with research interests in fluid driven granular flows.
3D CT scanning: The µ-VIS facility
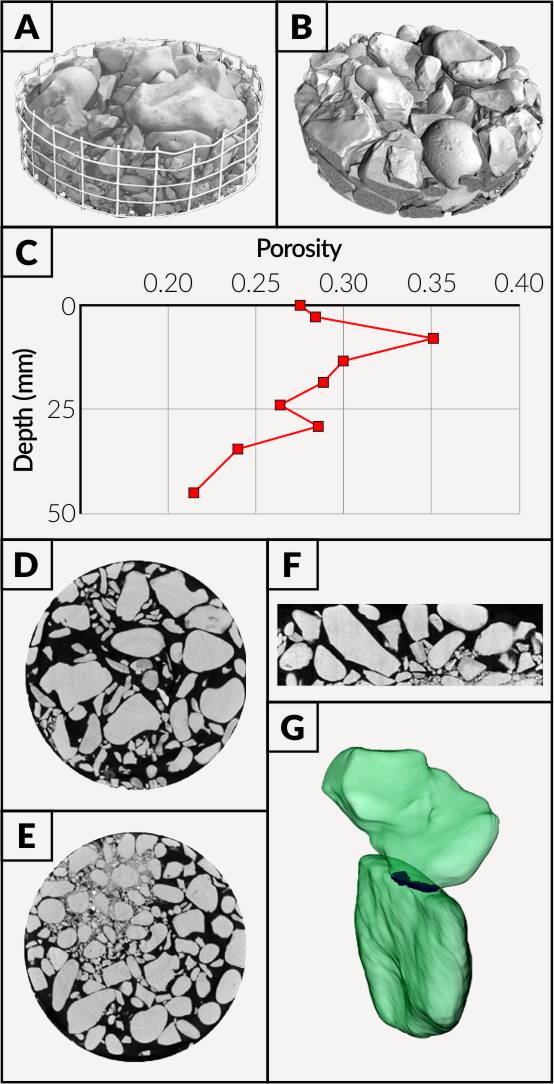
The quantification of 3D sediment structure for WP1 and WP2 will be undertaken using CT scanning. To date, full 3D analysis of natural and experimental gravel beds has been limited to small samples, and has not been used to quantify the structural properties of individual grains, which in turn can be used to calculate their value of critical shear stress. This project will do this for the first time. We are able undertake this research because of the presence of the EPSRC µ-VIS imaging facility at University of Southampton. The µ-VIS facility will be used to scan undisturbed bulk sediment samples (Fig. 2) from both the flume and the field at sub-millimetre resolution; the flume and field are 15 minutes and ~2 hours drive from the µ-VIS facility respectively.

We will work with project partners µ-VIS to tailor existing techniques for automated analysis of CT scan data to the specific project demands. In addition to visualisation, CT scan data allows derivation of a 3D point cloud at user-specified resolution. 3D mesh generation using Simpleware is routinely applied to CT scan data, and proof-of-concept tests demonstrate that this will work for the proposed gravel samples (Fig. 3). The CT data will be processed in order to quantify the full range of bed structure parameters required for application of the Hodge et al. (2013) version of the Kirchner et al. (1990) entrainment model, from which we will calculate critical shear stress for all surface particles > 8 mm. These parameters are grain volume, grain exposure and grain pivot angle; algorithms to measure these data have already been developed in partnership with µ-VIS. We will also directly measure packing throughout the sample volume via determination of framework and matrix porosity and bulk density. In addition we will directly measure the void volume, contact points and pore dimensions between framework gravels, and calculate absolute permeability using standard CT-scanning post-processing and Avizo Xlab-hydro software.
The calculated values of critical shear stress will be assessed by returning a small sample of the pots back to the flume. In the flume they will be repositioned within the bed, and subjected to increasing velocity until sediment entrainment from the pot is detected. An independent value of critical shear stress will be calculated from this flow velocity.
Suggested Reading
(Pdf) Haynes, H., Vignaga, E. and Holmes, W.M. (2009) Using magnetic resonance imaging for experimental analysis of fine-sediment infiltration into gravel beds. Sedimentology, 56(7), 1961-1975 (doi:10.1111/j.1365-3091.2009.01064.x)
(Pdf) Kleinhans, M.G., Jeukens, C.R.L.P.N., Bakker, C.J.G., and Frings, R.M. (2008) Magnetic Resonance Imaging of coarse sediment. Sedimentary Geology, 208(3-4), 69-78 (doi:10.1016/j.sedgeo.2008.07.002)
(Pdf) Sear, D.A., Damon, W., Booker, D.J. and Anderson, D.G. (2000) A load cell based continuous recording bedload trap. Earth Surface Processes and Landforms, 25(6), 659–672 (doi:10.1002/1096-9837(200006))